Update on an earlier post: Mini Project: Bibliographic Analysis of Computing
I have been curious about tools for analysing social connections for a while.
I have been curious about tools for analysing social connections for a while.
In this post I am looking at a couple of ways to analyse bibliographic relationships. Starting with the simplest, Word Clouds but then at an interesting tool VosViewer discussed previously. All the data is taken from the University of Northampton's Research Repository - Nectar - for members of the academic Computing team.
Word Clouds
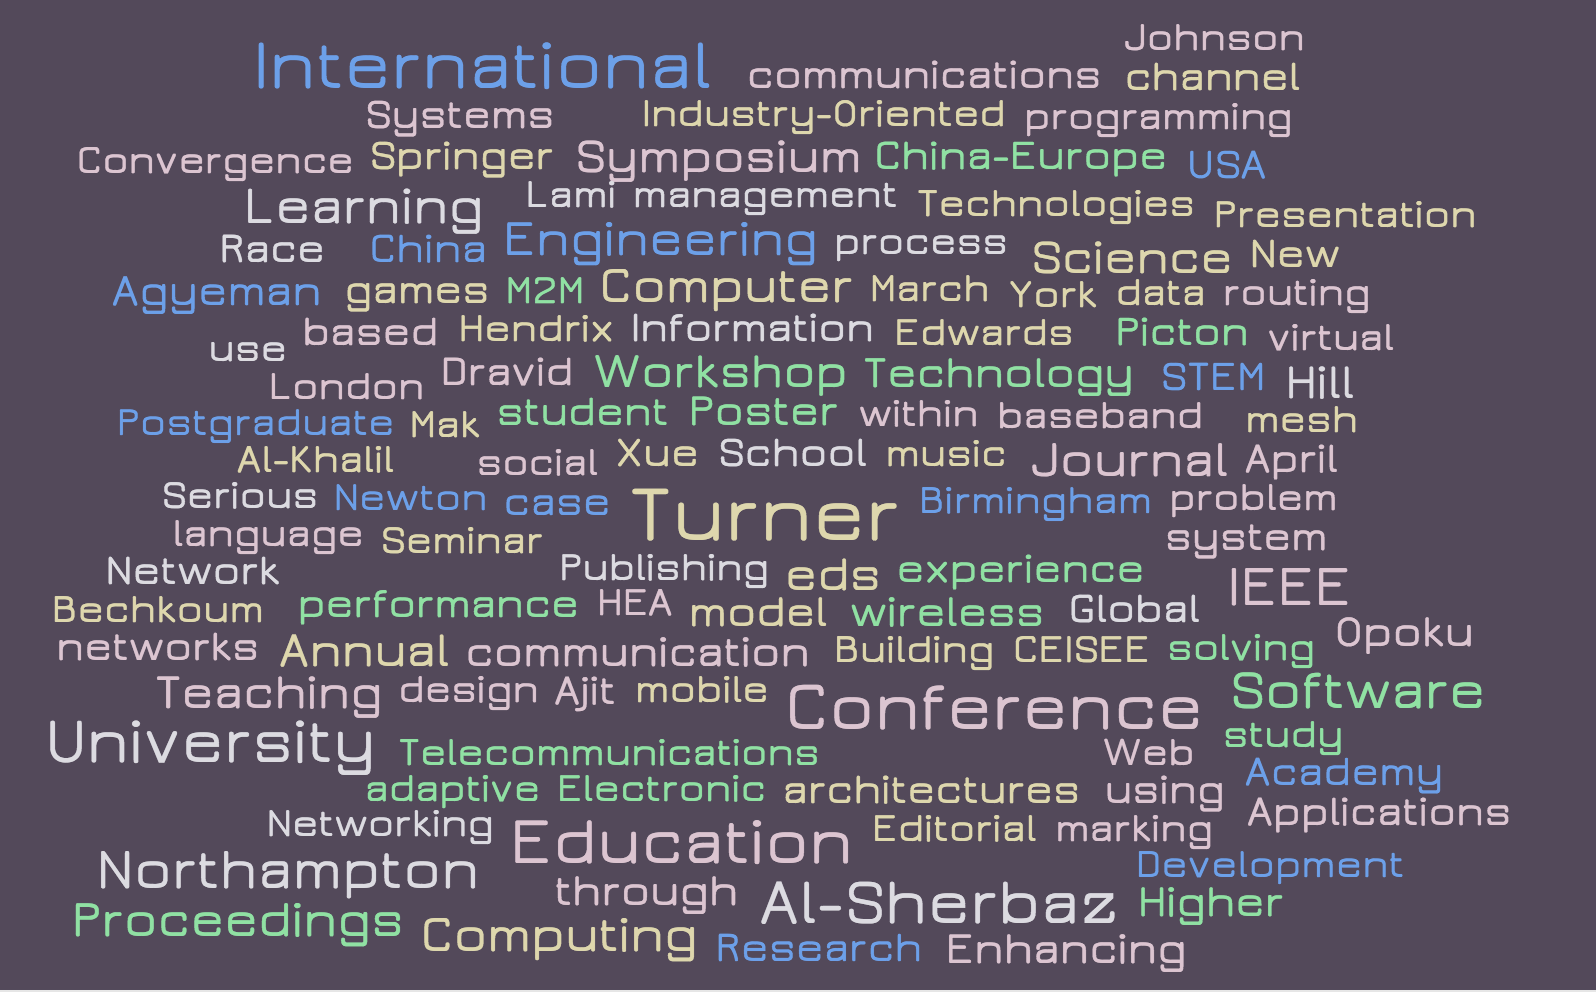
The image above is based on data for all the listed publications for the computing team since 2011. It includes the authors, title, conference, etc; but no abstract. It takes quite a bit of editing and really all that is being shown is the Authors name for the most published authors and a few key terms. Provides a nice snap shot but is difficult to interpret.
Co-author Analysis

Here is the same data but processed using software that is only looking at the authors and showing how many times a particular pair have published together. Some interconnections between authors can be seen. There are now connections between all the main authors (members of the computing team).

Co-authoring publications with MSc students is leading to greater opportunities to join research together.
Text Analysis
This is the same tool as above, but this time looking at the text within the title and abstracts. All words in the title and abstract of the papers; but using binary counting (so a term is only counted once per publication) and allowing only the terms with 60% highest relevance through; you can get a graph like the one below. Personally, I find the graph beautiful, gives a sense of a lot going on.

Some interesting subject area coming out; for example wireless networking and machine-to-machine communicaton; alongside pedagogic, cultural research and sensors for animals.
Let us apply this last approach to some individual cases
Case Study 1: Mid-Research Career Academic

Case Study 2: Mid-Research Career Academic 2

In both Case Study 1 and 2, there are several groupings. Case study 1 the subjects in the groupings are more diverse than in case study 2, which has greater specialisation.
Greater separation in the groups (though three groups are related in terms of subject) than in the first two case studies. This is in part may be due to the smaller number of papers compared to the first two case studies (between four to eight times fewer).

Case Study 4: PhD by Publication Candidate

There is a stronger inter-relationships between the groups, than has been in some of the other case studies. This, I would argue, is a positive feature for someone pursuing a PhD by publication; suggesting a coherent 'story' to their publications.
Plotting the citations to one author's papers
Using GEPHI (https://gephi.org/) a free Open Graph visialisation tool and ciaition data from Google Scholar plots and interconnections can be visualised.

The approach taken here was to take an individual paper (the larger blobs) and make a connection to all the papers that cited it (the smaller blobs where the papers not produced the author). Groups can start to be seen, that can be investigated further.
All views and opinions are the author's and do not necessarily reflected those of any organisation they are associated with. Twitter: @scottturneruon
No comments:
Post a Comment